Introduction

GFB’s range of Lightweight Under-Drive Pulley Kits are designed to improve acceleration by reduce the rotational mass (inertia) on the crankshaft as well as parasitic loads from the driven accessories.

The pulleys are manufactured from 6061 T6 billet aluminium on the latest precision CNC machines, and typically save up to 2.5kg of weight over the factory pulleys. Under-driving is achieved through the use of a smaller diameter crank pulley, which reduces the amount of drag from the accessories, particularly at high RPM. Note that GFB take care to ensure that accessory performance is not affected.

Performance Testing

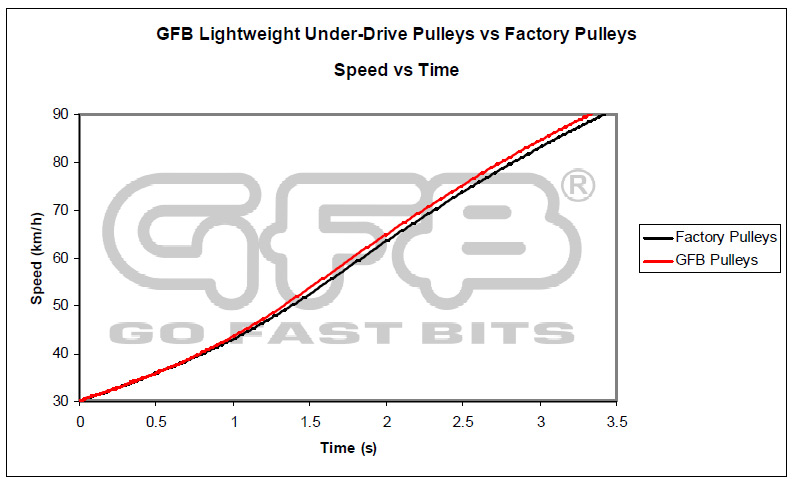
To determine the effectiveness of the GFB Lightweight Under-Drive Pulleys, a series simple real-world tests were performed using a G-Tech Pro Competition to record vehicle performance before and after fitting a GFB Lightweight Under-Drive Pulley kit.

A G-Tech meter is a device that records G-Force, time, and engine RPM 100 times per second. From these measurements, it is able to calculate road speed, distance travelled, and engine power/torque with very good repeatability. So why didn’t we dyno test the car?

Easy – all we (and the user) really want to know is “does my car go faster as a result of this modification”?

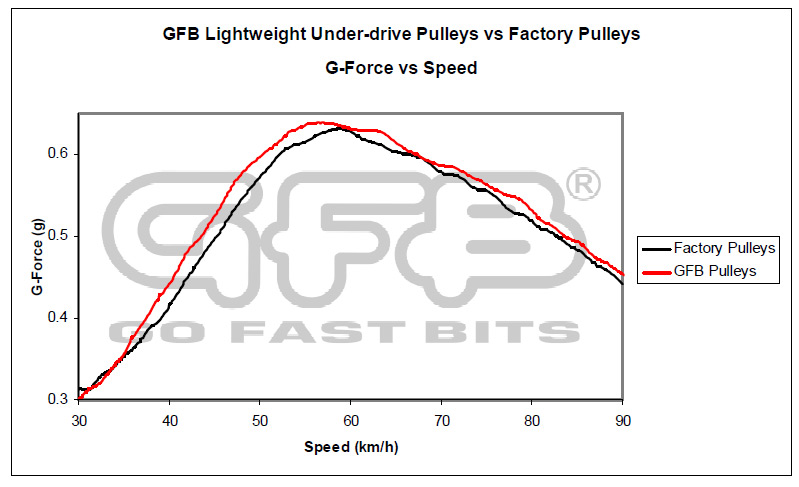
The G-Tech is perfectly suited for this, since it measures actual G-Force and time, which is exactly what we’re really interested in – G-Force is a direct measurement of how fast a car is accelerating, which is the thrust you feel by the seat of your pants when you mash the throttle – you can’t get more real-world than that!

In addition to the above, there is another very important reason why dyno testing is not used in this case:

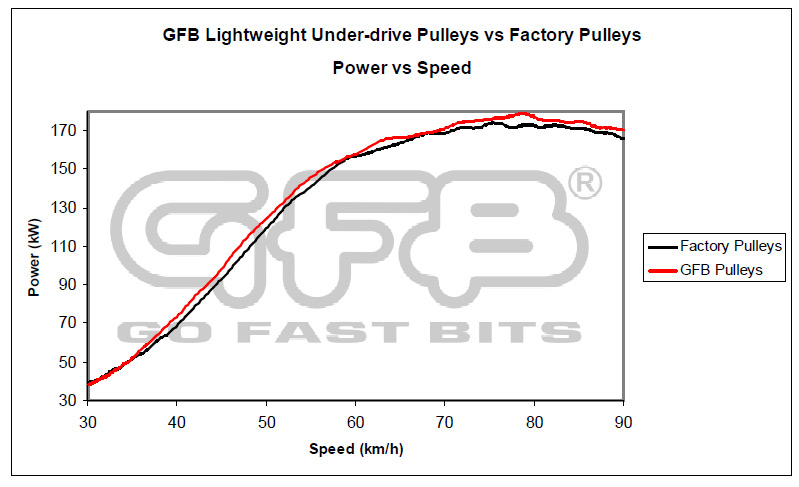
The GFB lightweight under-drive pulleys do not increase the amount of torque or power developed by the engine. They simply reduce the amount of mass that the engine must accelerate. Therefore, the faster the engine RPM is increasing, the greater the benefit will be from reduced pulley mass.

This effect does actually show up as a power increase on a dyno, however dyno testing does not replicate actual on-road acceleration, since the engine acceleration (as opposed to the car’s acceleration) is regulated to a constant and relatively slow rate of increase. When driving the car on the road, acceleration will vary in response to the engine torque curve (as well as other variables that need to be minimised, as discussed below). Therefore the power improvement shown on a dyno will be different (usually less) from what is calculated by the G-Tech based on the car’s actual acceleration.

Test procedures

The tests were performed on an MY07 Subaru STi, with the only other modifications being a GFB Respons TMS diverter valve, a 3” turbo-back exhaust and an ECU tune. With the factory pulleys in place, a series of in-gear pulls were recorded using the GTech meter. Three runs each were performed in 1st, 2nd and 3rd gear. The clutch was engaged from a standstill smoothly and gently up to a slow speed, whereupon the accelerator was floored and the engine swept right through its full RPM range (except for 3rd gear, where the tests had to be cut short due to the road speed limit), just as it would be on a dyno. No gear shifts or drag-racing type launches were included in the testing to eliminate as many variables as possible.

The GFB pulleys were then fitted, and the tests repeated.

Note that in the interest of minimising any potential sources of error, the following points are observed:

  • The same stretch of straight, level road was used for each run
  • The driving conditions between each pass were replicated so the engine and
  • intercooler received the same amount of cooling between passes
  • All tests were performed on the same day all within an hour – the ambient
  • temperature was the same (25 degrees C) from start to finish
  • The wind on the day was less than 8km/h during the testing
  • The total distance driven during the complete test series was less than 13km (including to and from the location where the pulley swap was performed), so
  • the fuel load variation would have been less than 2 litres.

Results

The 2nd gear runs were selected for comparison because the 1st gear passes were completed in less than 2 seconds, which makes measurement and comparison less accurate than a longer run, and the 3rd gear passes were not able to be performed to engine redline because of the speed limit present on the road used.In addition, 2nd gear is most used when accelerating hard on the street, since by redline the car will be travelling close to the fastest street-legal speeds in most cases.

Whilst the data was recorded from a stand-still to redline, it has been cropped to show from 30-90 km/h, which is 2100-6300RPM. This also ensures that the data does not include the very start and end of the runs where differences in throttle opening or closing may have occurred – i.e. the data is only shown for the time that the throttle is fully open, and the engine is already accelerating as it enters and exits the test speed range.

The graph of Speed vs Time shows the difference in acceleration from 30-90 km/h after the GFB pulleys were fitted.

The measured improvement from 30-90 km/h after fitting the GFB pulleys is 0.1 seconds, which is a 3% improvement.

The G-Force vs Speed chart is effectively the same as a dyno plot of engine torque, since G-Force is a direct product of engine torque accelerating the car forwards (minus the aerodynamic drag), and speed and RPM are synonymous when there is no wheelspin or clutch slip.
The GFB Pulleys can be seen to improve acceleration throughout the entire rev range, particularly during the period where the turbo is spooling up.

The average g-force increase from 30-90 km/h after fitting the GFB pulleys is 0.02g, which is a 4% improvement.

However, if we look at the 40km/h mark for example, even though the net improvement is still more or less the same as it is at 55km/h, the percentage improvement is much larger. This is because at 40km/h the engine’s available torque is much lower, so the gain is more noticeable.

At 40km/h (2800RPM), the g-force increase is 0.03g, which represents a 7.3% improvement.

This chart shows the calculated engine power during the run, again note that the horizontal axis is in speed. Since power is calculated from torque and RPM (even in the case of a dyno), this chart is really just a derivative of the G-Force chart, but it shown here for comparison since most advertised benefits are shown as power gains. The measured peak power improvement from 30-90 km/h after fitting the GFB pulleys is 5kW (178.7kW with GFB pulleys, 173.7kW with factory pulleys).

Peak power improvement is generally the figure used in advertising, but it only tells a small part of the story.

The important thing to note however that is that like the G-Force chart, a consistent improvement is seen right through the rev range. This is important because the effect is to make the car more tractable to drive day-to-day as well as faster overall.

Discussion

The results shown above are actually the pair of passes that show the smallest gains. Other tests could have been combined to show larger and better results, but this pair has the closest-matched conditions and represents the most honest results. Gains or losses resulting from variations in boost pressure or ECU-related adjustments are usually seen only in part of the rev range, as a bump or a dip, or a different shaped power/torque curve. The pair of runs chosen for comparison however, are very similar in shape, indicating that the engine is operating in as close to identical conditions as could be expected – the resulting improvement can therefore be said to be from the installation of the pulley kit only and not from external variations.

Conclusion

It can be seen in these results that fitting a GFB Lightweight Under-Drive Pulley Kit does in fact produce an honest, measurable and repeatable improvement in acceleration throughout the entire engine rev range. The tests revealed that the minimum recorded improvements after replacing the factory pulleys with the GFB Lightweight Under-Drive Pulleys were:

  • 3% faster (0.1 seconds) from 30-90 km/h
  • 4% higher average G-Force (0.02g) from 30-90 km/h
  • 7.2% higher G-Force (0.03g) at 40km/h (2800 RPM)
  • 5kW peak power increase (173.7kW to 178.7kW)

The results charts all tell the same story, which is a consistent improvement in GForce throughout the 30-90 km/h test, which results in more power and consequently a faster time to 90km/h.

Importantly (especially on turbo engines), the G-Force improvement off-boost and during spool-up are enhanced by a much larger percentage because of the limited engine torque available at low RPM. This gives the car what can be best described as a noticeably “livelier” feel in the lower rev range, and a greater willingness to rev during acceleration.

This is unlike many other engine modifications that improve power through increased airflow, since such gains are usually only available for a portion of the rev range, and often the ECU is required to be re-tuned to suit. The GFB pulleys however offer their benefits independently of the engine tuning, and regardless of how much power it makes.